Unifying and Visualizing Data to Unlock Insight at the Foundations of Catholic Health
Catholic Health (Buffalo, NY) is a nonprofit healthcare system of more than 9,000 associates and 1,300 physicians formed in 1998 under religious sponsors in Western New York. The organization provides health services through their hospitals, primary care centers, diagnostic and treatment centers, home care agencies, and other programs. The Foundations of Catholic Health help raise funds for the healthcare ministries of Catholic Health of Western New York. The funds raised help to create healthy communities, advance clinical innovation, and provide an extraordinary experience of care.
The Opportunity
The Catholic Health system consists of five hospitals, each with its own separate foundation. While the five individual foundations had metrics in place for tracking fundraising data, there wasn’t a single, unified source of truth. Decision makers could only view and access donor data within their own unique foundation. That meant they couldn’t measure or understand the correlation between donors across the five foundations – unless it was done manually.
In addition, the leadership team was limited in their ability from a data insight perspective to solve problems and bring about positive change. For instance, if one foundation was growing and another struggling, was it because they were cannibalizing their own donors from a different foundation within the system? Or was the decline due to external forces? Anecdotal information was relied upon more so than data-driven insight to make strategic fundraising and marketing decisions.
The Strategy
The Foundations of Catholic Health needed  an analytics platform that provided a unified view of data streams across all five individual foundations. However, as fundraising professionals – not software engineers – the solution needed to be easy to use and understand.
To start, our team gathered seven years of donor information across each foundation and cleansed it for accuracy. We then developed a connected database with details on each donor, such as name and address, gift amounts, gift dates, and codes to explain how the gift was acquired, which hospital it was given to, and from which campaign it was brought in.
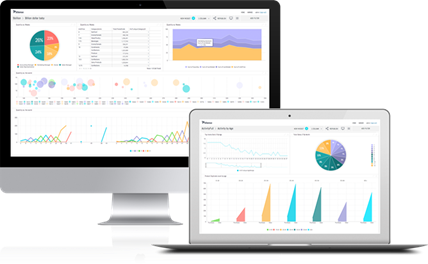
With the data in place, our next step was to develop an intuitive customer facing platform that made it easy to track, access, view, and share all this data. It was a perfect fit for 3DV Analytics. We then customized the platform so that it provided a 3D view of donor information. Think Google Analytics, but at a deeper, easier-to-understand level. Through pivot charts and interactive visualizations, it enabled better insight into key nonprofit metrics, including donor renewal rates, new donor retention and lapsed donor reactivation rates. It also correlated donors, campaigns and trends across the five foundations in a visual way.
The Results
3DV Analytics consolidated disparate processes, communications, and donor data into one, easy-to-use solution. It unified data across five different streams; enhanced it, making it easy to access and pull key insights from; and tracked it uniquely, across each individual foundation, as well as across the health system as a whole. In short, we made big data easy to digest and learn from.
Gone are the days of relying on shaky anecdotal information. With our solution, leadership can now explore, analyze, summarize, and present donor data in a simple, clear way among all five foundations. As a result, they can make dependable, smarter data-driven decisions on budgets and strategy. They also have all the information necessary – right at their fingertips – to identify trends, diagnose issues, and produce more targeted and fruitful fundraising campaigns.